Visualization
Heatmap and cluster filtering
Visualize density or isolate records in a selected cluster.
Enable Heatmap Layers
- Open the PRO menu.
- In Pro Configuration, enable Heatmap Layers.
- Close the configuration panel to view density across the map.
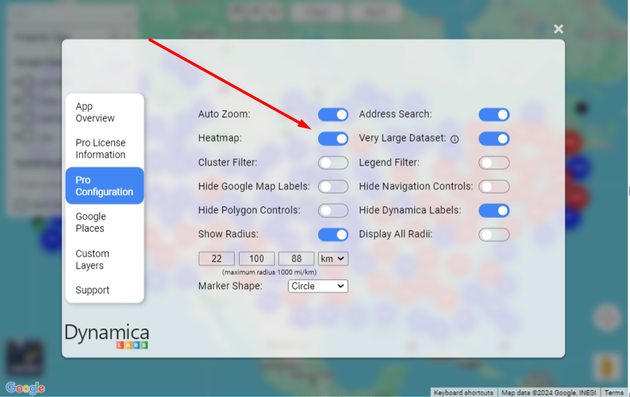 Heatmap layer displayed over the United States
Filter by cluster
- In Pro Configuration, enable Cluster Filter.
- Select a cluster on the map.
- The markers in that cluster remain visible while other clusters disappear.
- Use Back to return to the previous state.
 Cluster Filter option and clustered markers