
Add from AppSource
- Open Power BI Desktop.
- In the Visualizations pane, select the three-dot menu.
- Choose Get more visuals.
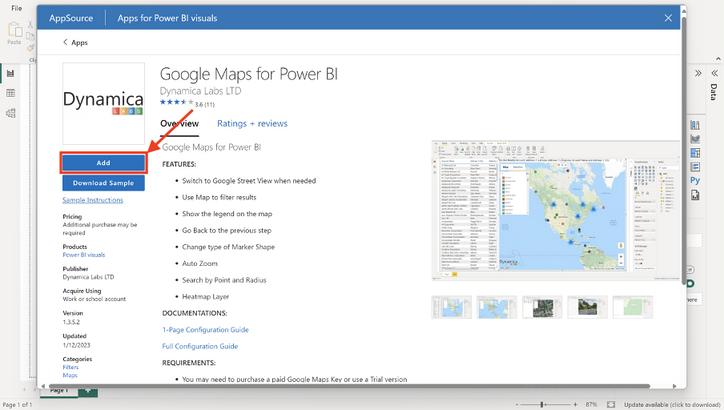
- Search for “Google Maps”.
- Select the Dynamica Labs visual and choose Add.
- Select the new Google Maps for Power BI icon in the Visualizations pane.
Load report data
After the visual is on the canvas, load or connect the report dataset. The visual requires geographic coordinates; the supplied configuration guide does not support converting a plain-text address directly into a plotted record.
Note
Addresses used by the Address Search feature are a separate interactive search capability. Dataset records still require coordinates according to the supplied setup guide.